 FORGE
Profile Theory
What auction theory says about today’s session, and how many times it has held on your chart.
What it measures
The profile theory (or auction theory) describes how a session usually behaves depending on where it opens relative to yesterday’s value: the zone where 70% of the volume traded, with its POC (the most traded price), its VAH (upper edge) and its VAL (lower edge). This indicator puts those rules on the chart: it tells you which ones apply today, what each one anticipates and, next to it, how many times it has held on that same chart.
It is a context reading. It is not a signal or a recommendation: each rule says what the text expects to happen, and what is measured is how often it happened in the sessions you have loaded, not a guarantee that it will happen.
The value, the POC, the VAH and the VAL come from each session’s footprint. What only needs the candles (the Initial Balance, poor highs and lows) can be read even without the footprint.
How it’s calculated
The indicator works with regular sessions (the asset’s RTH hours). For each one it calculates:
- The profile: the volume at each price, the POC and the value area (70% by default), from the footprint.
- The periods: the session is cut into 30-minute segments, like the letters of the market profile (TPO).
- The Initial Balance (IB): the range of the session’s first hour.
- The poor extremes: a high (or a low) is poor when several periods reach it, with no tail finishing it off. A tolerance of 2 ticks is allowed.
Each prediction is born on a specific candle and only looks at the candles that follow, so the same count works for today’s session and for earlier ones. For each rule the baseline is also counted: the same question without the theory’s condition. Without that comparison, a percentage tells you nothing: almost any level gets touched many times if you give it several sessions.
You need candles of 30 minutes or less (the period in the settings): with thicker candles there are no periods or IB to read, and the indicator warns you.
How to read it
There are nine rules. Each one is turned on and off separately in the Rules section.
| Rule | Condition | What the text expects |
|---|---|---|
| Opens inside value: rotation | The session opens inside yesterday’s value. | It closes inside that value. |
| Opens outside and accepts it: moves away | It opens outside yesterday’s value and the whole IB stays outside, without returning. | It closes outside, on the same side. |
| 80 % rule | It opens outside, returns to value and two consecutive periods close inside. | It travels across the value to the opposite edge before the close. |
| Narrow IB: trend day | The IB is smaller than 75% of the normal IB (the median of the last 20 sessions). | The day’s range reaches 2 times the IB. |
| Wide IB: range day | The IB is larger than 125% of the normal IB. | The day’s range does not exceed 1.5 times the IB. |
| Poor high: price returns to it | Yesterday’s high was left poor and today opens below it. | Price touches it again today. |
| Poor low: price returns to it | Yesterday’s low was left poor and today opens above it. | Price touches it again today. |
| Naked POC: price returns | The POC of a session that the next one did not touch. | Price touches it within the next 5 sessions. |
| Value migration: continues | Yesterday’s POC, VAH and VAL are all above (or below) those of the day before. | Today’s POC ends up above (or below) yesterday’s again. |
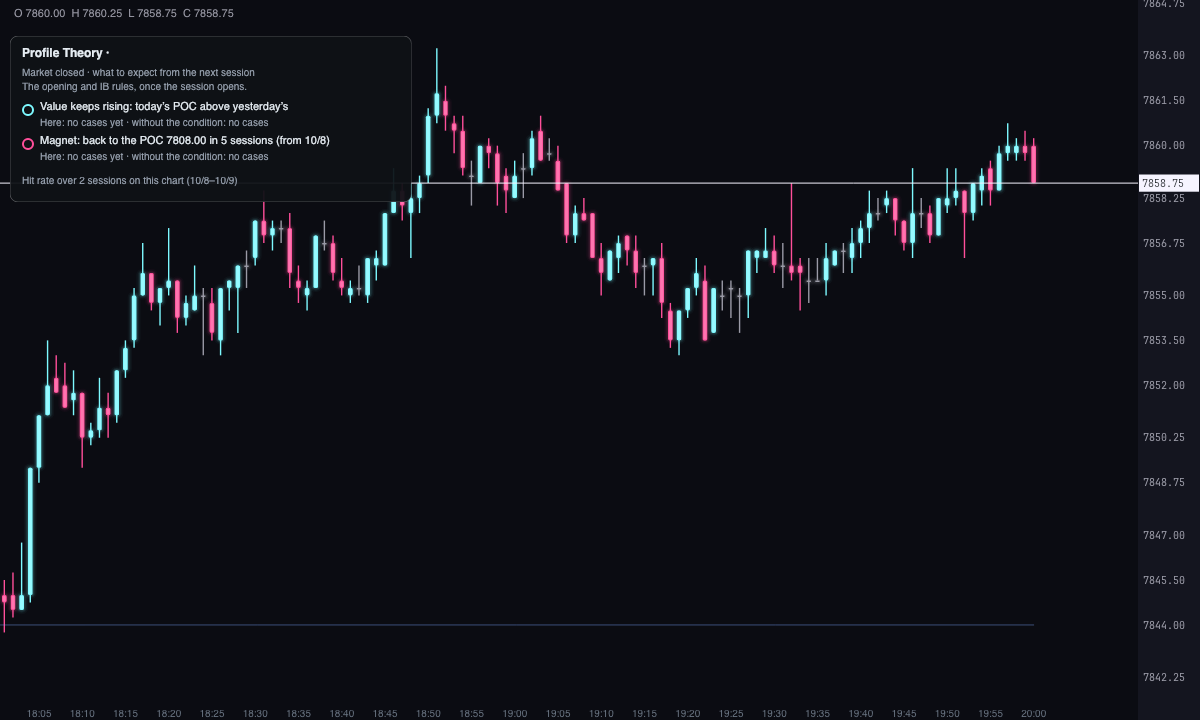
On the chart, each rule that applies leaves:
- A mark with its name on the candle where the condition is already known, and a line to its target.
- The result, where it’s decided: a filled circle with the word holds, or a ring with the word fails. The direction and the result are always written out, not only shown in color.
- The Initial Balance of each session, as a blue box with its edges extended to the close.
- The naked POCs still in force, as dashed lines to the right edge.
The reading box (a corner of the chart) describes today’s session: where it opened, yesterday’s value and POC, the IB and which rules apply. For each one it shows “Here: X of N · without the condition: Y of M”: how many times it held on this chart with the condition and how many without it. If there are fewer than 20 cases, it warns you with few cases. With the market closed, the box describes what to expect from the next session.
Scenarios
Off by default. With Project scenarios on, the indicator tells, as a narrative, the paths the theory considers possible from where price is now: up to three, each with what confirms it, where it points and what invalidates it. It draws the zone, the line that confirms it (dashed) and the targets, with their labels E1, E2 and E3, ahead of the last candle.
- They are sorted by what is measured on your chart, from most times to fewest. Those that no rule measures come last and say so: not measured on this chart.
- The narrative replaces the reading box in its corner: it already carries each scenario’s figures. When you turn them off, the box returns.
- It always ends with the same sentence: what is measured belongs to this chart, a frequency and not a guarantee.
Adding it to the chart
In the chart bar, Indicators ▾ › More Indicators…. You’ll find it in the Volume / Order Flow category. It arrives through the indicators channel: it shows up in the list a few seconds after Forge opens. It’s drawn over the price, on the chart itself. How to add and adjust an indicator is in Indicators.
To read the value it needs the footprint of the earlier sessions; the more sessions you have loaded, the more cases each rule will have.
Settings
Open them with the ⚙ on its row in Indicators ▾. Each section collapses and expands separately.
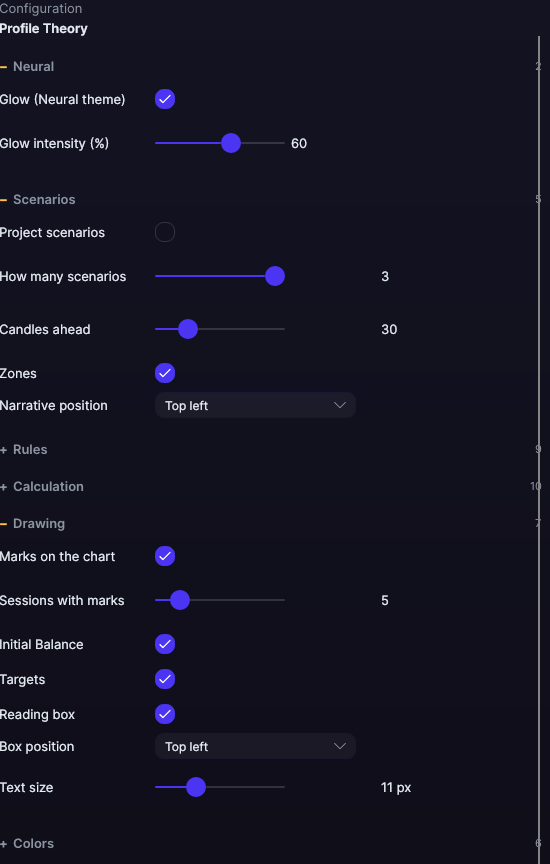
| Setting | Default | What it does |
|---|---|---|
| Scenarios | ||
| Project scenarios | No | Counts the possible paths from the current price and draws them ahead. |
| How many scenarios | 3 | From 1 to 3. |
| Candles ahead | 30 | How far they are drawn, from 6 to 120 candles. |
| Zones | Yes | Draws each scenario’s zone. |
| Narrative position | Top left | Top left, Top right, Bottom left or Bottom right. |
| Rules | ||
| Opens inside value: rotation | Yes | Reads this rule. |
| Opens outside and accepts it: moves away | Yes | Reads this rule. |
| 80 % rule | Yes | Reads this rule. |
| Narrow IB: trend day | Yes | Reads this rule. |
| Wide IB: range day | Yes | Reads this rule. |
| Poor high: price returns to it | Yes | Reads this rule. |
| Poor low: price returns to it | Yes | Reads this rule. |
| Naked POC: price returns | Yes | Reads this rule. |
| Value migration: continues | Yes | Reads this rule. |
| Calculation | ||
| Value area | 70% | The percentage of the volume that the value encloses, from 50 to 90%. |
| Minutes per period (TPO) | 30 min | From 5 to 60 min, in steps of 5. The candles cannot be thicker. |
| Initial Balance minutes | 60 min | From 15 to 120 min, in steps of 15. |
| Sessions for the normal IB | 20 | How many earlier sessions the normal IB is calculated from, from 5 to 60. |
| Narrow IB: below | 75% | Of the normal IB, from 30 to 100%. |
| Wide IB: above | 125% | Of the normal IB, from 100 to 250%. |
| Trend: the day reaches | 2 IB | From 1.5 to 4 IB, in steps of 0.25. |
| Range: the day does not exceed | 1.5 IB | From 1 to 3 IB, in steps of 0.25. |
| Poor extreme: tolerance | 2 ticks | How far a period can stay below the high (or above the low) and still count as being at it, from 0 to 8 ticks. |
| Naked POC: sessions to return | 5 | From 1 to 20 sessions. |
| Drawing | ||
| Marks on the chart | Yes | Draws the rule marks and their result. |
| Sessions with marks | 5 | From 1 to 30 sessions. |
| Initial Balance | Yes | Draws each session’s IB box. |
| Targets | Yes | Draws the line to each rule’s target and the naked POCs. |
| Reading box | Yes | Shows the box with today’s session and what is measured. |
| Box position | Top left | The same four corners. |
| Text size | 11 px | From 9 to 16 px. |
| Colors | ||
| Upward · Downward · No direction | Ice · Pink · Amber | The color of each mark according to where it points. |
| Initial Balance | Blue | The IB’s box and edges. |
| Fulfilled · Failed | Green · Red | The color of the result. |
| Neural | ||
| Glow (Neural theme) | Yes, when added | A halo of light in the color of each line or mark, like the one on the Neural theme candles. A newly added indicator comes with it checked; the ones you already had saved don’t. |
| Glow intensity (%) | 60% | From 0 to 100%. |
Settings belong to each chart: changing the Profile Theory on one chart doesn’t change it on another.