 FORGE
MACD
The difference between two price averages: momentum, and when it changes.
What it measures
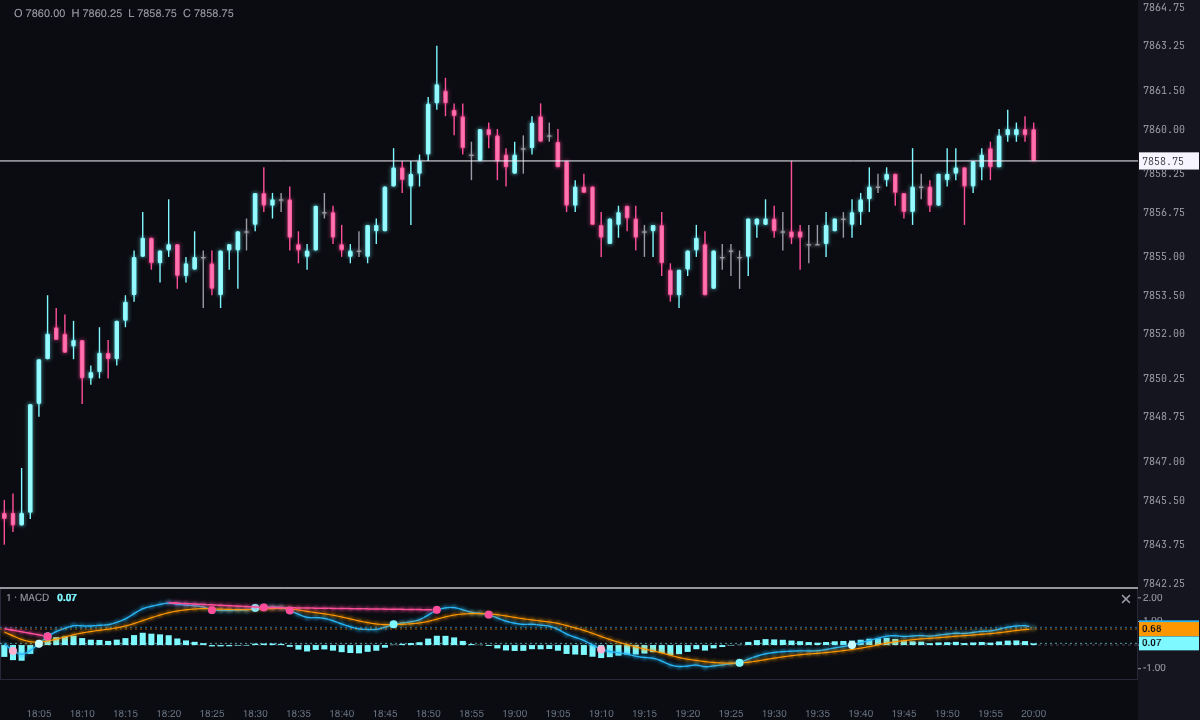
The MACD (Moving Average Convergence Divergence) is the difference between a short and a long exponential moving average of price. When the short one pulls away above the long one, momentum is bullish; when it pulls away below, bearish.
How it’s calculated
- MACD line = 12-period exponential moving average − 26-period exponential moving average.
- Signal = 9-period exponential moving average of the MACD line.
- Histogram = MACD − signal.
How to read it
- Above or below zero: the short average is above or below the long one.
- MACD against its signal: the cross marks a change in momentum; the histogram shows that distance.
- Histogram: when its bars start to shrink, momentum is fading before the cross arrives.
Built-in strategies
What the indicator already has inside and can mark for you on the chart. They show what has happened; they are not recommendations.
Signal cross
On by default- What it marks
- A mark in the strip when the MACD line crosses its signal. It can be filtered to keep only buys below zero and sells above zero.
- Alert
- Blinks when it appears; on-screen alert and sound if you turn them on.
- Turned on with
- «MACD and signal crossover», in Signals; the filter, «Only buys below zero and sells above zero».
Zero cross
On by default- What it marks
- A mark when the MACD line moves above or below zero.
- Alert
- Blinks when it appears; on-screen alert and sound if you turn them on.
- Turned on with
- «Zero crossover», in Signals.
Histogram turn
Off by default- What it marks
- A mark when the histogram stops growing and turns, with a minimum size if you want one.
- Alert
- Blinks when it appears; on-screen alert and sound if you turn them on.
- Turned on with
- «Histogram turn», in Signals.
Regular divergences
On by default- What it marks
- A dot on each pivot and a line between the two, in the strip, when price makes a higher high and the indicator a lower one (bearish), or the other way around with the lows (bullish).
- Alert
- Blinks when it appears, on the candle that confirms the pivot; on-screen alert and sound if you turn them on.
- Turned on with
- «Regular divergences», in Signals.
Hidden divergences
Off by default- What it marks
- Price makes a higher low and the MACD a lower one (bullish), or the other way around with the highs. They point to the trend continuing.
- Alert
- Blinks when it appears; on-screen alert and sound if you turn them on.
- Turned on with
- «Hidden divergences», in Signals.
Only with the trend
Off by default- What it marks
- Keeps only the signals in the direction of an exponential moving average (200 by default).
- Alert
- It filters the alerts too.
- Turned on with
- «Only with the trend», in Signals.
Adding it to the chart
In the chart bar, Indicators ▾ › More Indicators…. You’ll find it in the Oscillators / Momentum category. It’s drawn in its own strip, below the candles. How to move and adjust a strip is in Indicators.
Settings
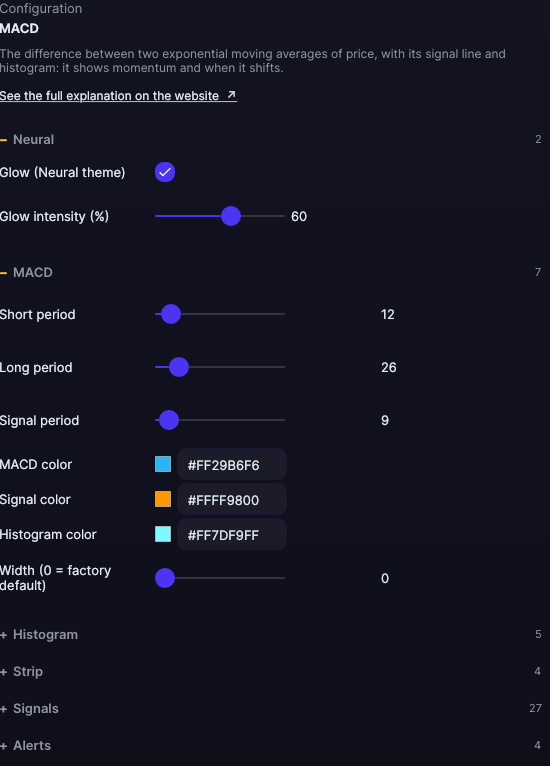
Open them by double-clicking its strip, or with the ⚙ on its row in Indicators ▾. Each section collapses and expands on its own.
| Setting | Default | What it does |
|---|---|---|
| MACD | ||
| Short period · Long period · Signal period | 12 · 26 · 9 | From 1 to 200. |
| MACD · signal · histogram color | Blue · Orange · Ice | The colors of the three series. |
| Width (0 = factory default) | 0 | From 0 to 10; with 0 the factory width is used (1.4 px). |
| Histogram | ||
| Coloring | Single color | Single color, By sign or By sign and slope (four colors: positive rising or falling, negative falling or rising). |
| Color positive and rising · positive and falling · negative and falling · negative and rising | Ice · Light ice · Pink · Light pink | The four colors of By sign and slope; By sign uses the first and the third. |
| Strip | ||
| Zero line · Zero line color (0 = automatic) · Value on the axis · Strip height | Yes · Automatic · Yes · 92 px | Like the other strips. |
| Signals | ||
| MACD and signal crossover · Bullish crossover color · bearish | Yes · Ice · Pink | Marks the crosses. |
| Only buys below zero and sells above zero | No | Filters the crosses. |
| Zero crossover · Upward color · downward | Yes · Light ice · Light pink | Marks when the MACD line crosses zero. |
| Histogram turn · Minimum turn size (% of the largest of the last 100 candles) · Bullish turn color · bearish | No · 0% · Amber · Orange | Marks when the histogram turns; the minimum size, from 0 to 100%. |
| Regular divergences · Hidden divergences · Bullish divergence color · bearish · Hidden bullish divergence color · bearish | Yes · No · Ice · Pink · Soft turquoise · Lilac | Against the MACD line or the Histogram (Compare the price with, the line by default), with pivots of 5 candles on each side (from 2 to 20) and at most 60 apart (from 5 to 300). With Draw the divergence line (yes) and its Line width (1.5 px, from 0.5 to 4) each pair of pivots is joined. |
| Only with the trend · Period | No · 200 | Keeps only the signals in the direction of an exponential moving average; the period, from 10 to 400. |
| Also mark on the price · Mark size · Days with signals | No · 4 px · 5 days | Where, how big (from 2 to 12 px) and for how many days they’re marked. |
| Alerts | ||
| Blink on new signals · On-screen alert · With sound · Alert color | Yes · No · No · Light blue | How it alerts on the signals of the last candle. |
| Neural | ||
| Glow (Neural theme) | Yes, when added | A halo of light in the color of each line or mark, like the one on the Neural theme candles. A newly added indicator comes with it checked; the ones you already had saved don’t. |
| Glow intensity (%) | 60% | From 0 to 100%. |
Settings belong to each chart: changing the MACD on one chart doesn’t change it on another.