 FORGE
Key Candle
The candle that breaks a zone and leaves its own: it only counts if price follows through, and its zone stays drawn until it is broken.
What it measures
A key candle is the candle that breaks a zone: a sideways range, where price drifts back and forth without a trend, or the zone of the previous key candle. It only counts if price keeps going in the direction of the breakout; if it comes back, it was a false breakout and it is discarded.
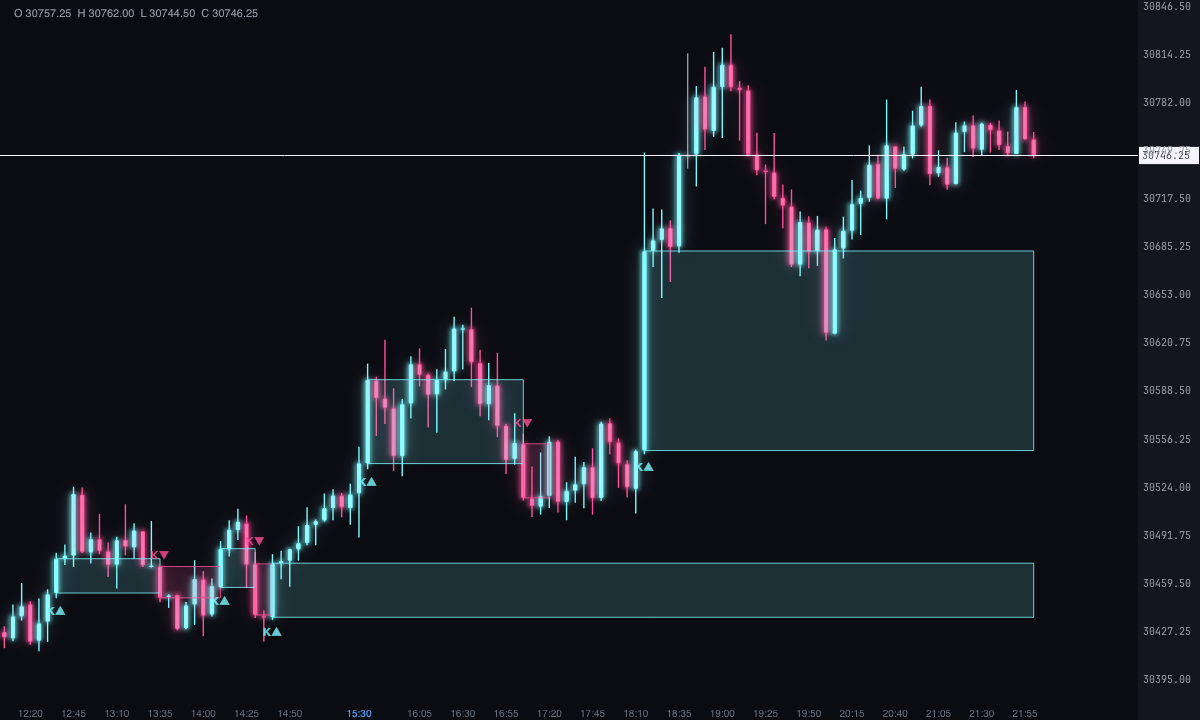
Key Candle marks those candles and draws the zone they leave behind. The idea is to wait for price to leave the zone and come back to it.
It marks what has happened; it isn’t a recommendation or a buy or sell signal.
How it is calculated
- The range: by default it starts where the previous impulse stops and lasts as long as it lasts, with at least 6 candles. To count as a range it can be at most 4 times the average candle tall, have no trend (price ends at most half of its height from where it started) and have touched each edge at least 2 times. A session break interrupts it.
- The previous zone: the zone of an earlier key candle that is still alive can also be broken.
- The breakout: by default, a candle that closes outside the zone. It is confirmed by two consecutive closes outside; if the second candle goes back inside, it is discarded and the range continues. Without that option, price has to pass the candle’s extreme within the next 5 candles, and if it closes on the other side of its zone first, it is discarded.
- The strongest: if several candles break the same zone, the one that closes closest to its extreme stays.
- The opposing zone: if the candle leaving a range closes inside a live opposing key zone, it does not count yet.
- The zone: by default, the body of the key candle. It extends until a candle closes on the other side.
- Closed candles only: the candle still forming marks nothing. By default it looks at the last 30 days.
How to read it
- The key candle gets a border and the mark K▲ (bullish, below the candle) or K▼ (bearish, above).
- Its zone is an ice (bullish) or pink (bearish) band that continues until price breaks it.
- Those from other timeframes carry the timeframe next to the mark, for example K▼ 15m, and are painted beneath those of the chart.
- With “Show the discarded ones (breakouts that did not follow through)”, false breakouts appear with a dashed violet border.
Which chart to use it on
By default it looks for key candles on the chart’s own candles. In Calculation you can also turn on those of 5, 15 and 30 minutes, 1 hour, 4 hours and daily: they are calculated with candles cut at New York time and painted over this chart’s. That way you see the 15-minute or 1-hour zones while you trade on a 5-minute chart.
Built-in strategies
What the indicator already has inside and can mark for you on the chart. They show what has happened; they are not recommendations.
Confirmed key candle
On by default- What it marks
- The key candle with a border and its K▲ or K▼ mark, and its zone (by default, the candle body) drawn until a candle closes on the other side: ice for the bullish one and pink for the bearish one.
- Alert
- If you turn them on: when a key candle is confirmed and when price returns to its zone, with optional sound.
- Turned on with
- “Bullish key candles” and “Bearish key candles”, under Calculation; the alerts, under Alerts.
Key candles from other timeframes
Off by default- What it marks
- Key candles from 5, 15 and 30 minutes, 1 hour, 4 hours or daily, on this chart’s candles and with their timeframe next to the mark (for example, K▼ 15m).
- Alert
- The same alerts.
- Turned on with
- “5-minute”, “15-minute”, “30-minute”, “1-hour”, “4-hour” and “Daily (trading day)”, under Calculation.
Discarded breakouts
Off by default- What it marks
- Breakouts that did not follow through, with a dashed violet border.
- Alert
- No alert: you see it on the chart.
- Turned on with
- “Show the discarded ones (breakouts that did not follow through)”, under The mark.
Adding it to the chart
In the chart bar, Indicators ▾ › More Indicators…. You’ll find it in the Other category. It is drawn over the price. How to add and adjust an indicator is in Indicators.
Settings
Open them with the ⚙ on its row in Indicators ▾.
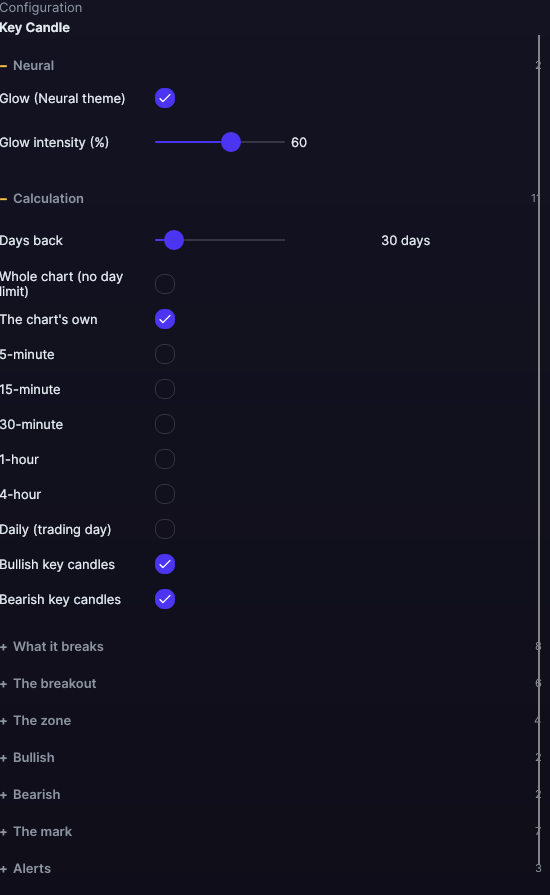
| Setting | Default | Range |
|---|---|---|
| Calculation | ||
| Days back | 30 days | 1 to 365 |
| Whole chart (no day limit) | No | |
| The chart's own | Yes | |
| 5-minute | No | |
| 15-minute | No | |
| 30-minute | No | |
| 1-hour | No | |
| 4-hour | No | |
| Daily (trading day) | No | |
| Bullish key candles | Yes | |
| Bearish key candles | Yes | |
| What it breaks | ||
| Range: starts where the impulse stops (free length) | Yes | |
| Minimum candles in the range | 6 candles | 3 to 200 |
| Maximum height of the range (times the average candle; 0 = no cap) | 4× | 0 to 30 |
| Range without trend: price ends at most this % of its height from where it started (100 = no limit) | 50 % | 10 to 100 |
| Range: minimum touches on each edge (0 = not required) | 2 | 0 to 10 |
| Range: width of each edge (% of its height) | 20 % | 5 to 50 |
| Also the zone of the previous key candle | Yes | |
| If it closes inside an opposing key zone, it does not count yet | Yes | |
| The breakout | ||
| When it breaks | Closing outside | Closing outside · The wick is enough |
| Confirmed by two consecutive closes outside | Yes | |
| Without two closes: candles to confirm it (price follows through) | 5 candles | 1 to 30 |
| If several break the same zone, the strongest | Yes | |
| Minimum strength (close near its extreme) | 0 % | 0 to 100 |
| Minimum candle size (times the average candle; 0 = any) | 0× | 0 to 10 |
| The zone | ||
| Draw the zone | Yes | |
| The zone comes from | The candle body | The candle body · The whole candle (wick to wick) |
| How far it extends | Until it is broken | Until it is broken · A fixed number of candles · To the end of the chart |
| Duration in candles | 60 candles | 1 to 1000 |
| Bullish | ||
| Fill color | Ice, translucent | |
| Border color | Ice | |
| Bearish | ||
| Fill color | Pink, translucent | |
| Border color | Pink | |
| The mark | ||
| Border around the key candle | Yes | |
| Border width | 1.5 px | 0.5 to 6 |
| Write K▲ / K▼ | Yes | |
| Write the timeframe (if it is not the chart's) | Yes | |
| Font size | 11 px | 6 to 30 |
| Show the discarded ones (breakouts that did not follow through) | No | |
| Color of the discarded ones | Violet, translucent | |
| Alerts | ||
| When a key candle is confirmed | No | |
| When the price returns to its zone | No | |
| With sound | No | |
| Neural | ||
| Glow (Neural theme) | Yes, when added | |
| Glow intensity (%) | 60% | 0 to 100 |