 FORGE
Economic calendar
The releases that move the market, marked on the time axis without covering the candles.
What it does
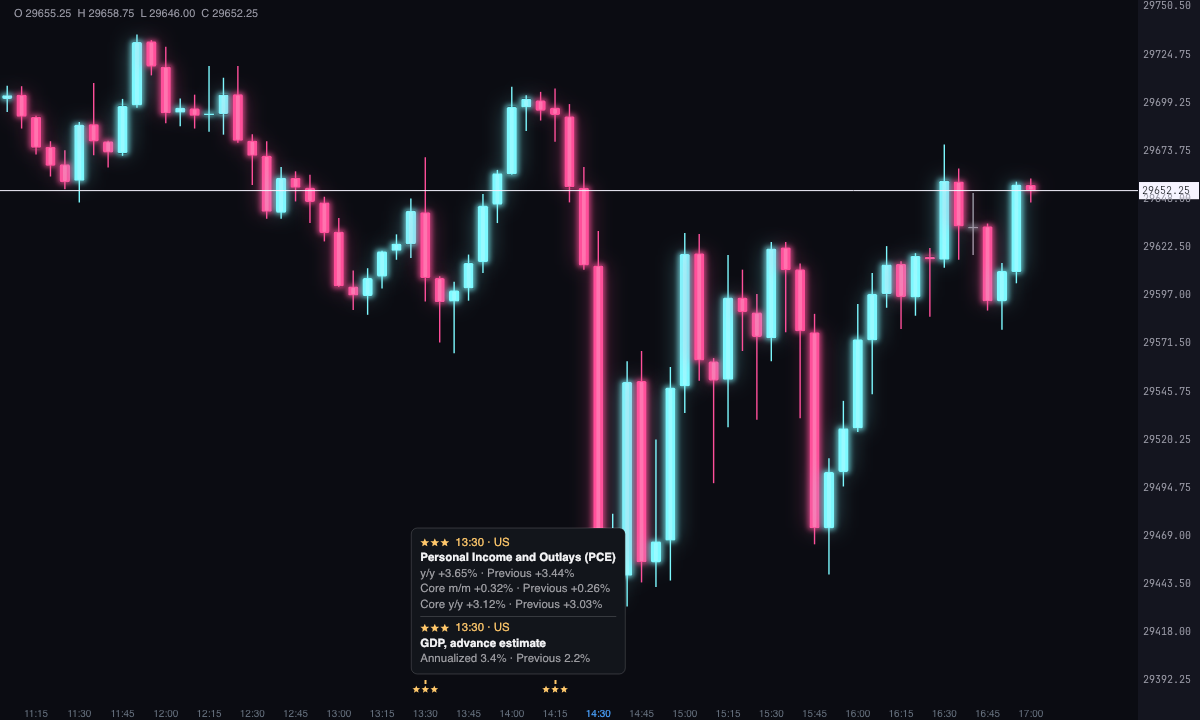
It puts a notch on the top edge of the time axis at the time of each economic release, with 1, 2 or 3 stars below it depending on its impact. It draws nothing over the candles.
Hovering over the notch opens its card: the stars, the time, the country, the name of the release and, once it is out, the published figure next to the previous one.
The releases are the ones in our economic calendar, with the dates and times set by the official agencies. When a figure comes out, it shows up on the card by itself as soon as it appears in the calendar.
How to read it
- The stars:
★★★ Moves index futures, bonds and the dollar hard. Expect high volatility around the release time.
★★ Usually moves the market, especially when the number surprises.
★ Small effect; matters more when it lands alongside other releases. - The colors: by default, amber for 3 stars, violet for 2 and gray for 1.
- The time: the one on the card is the time of your chart’s axis.
- Two at the same time: share a notch; the one with more stars is shown and the card lists both, like PCE and GDP in the picture.
- The figures: appear as on the calendar page. “m/m” and “y/y” are the change from the previous month and from the same month a year earlier; “q/q”, from the previous quarter; the Fed’s rates, as a range. Before the figure is out, the card shows only the previous one.
- What’s coming: on time-based charts, releases that are not out yet appear in the space to the right of the last candle.
It marks when each release comes out. It is not a recommendation or a buy or sell signal, and it sends no alerts.
Which releases it shows
The 22 on the calendar page, from the United States and the euro area. By default only the 3-star ones are shown; in the settings you can also show the 2-star ones, or all of them, and remove the ones you don’t want.
| Release | Country | Stars |
|---|---|---|
| Employment Situation (Nonfarm Payrolls) | US | ★★★ |
| Consumer Price Index (CPI) | US | ★★★ |
| Producer Price Index (PPI) | US | ★★ |
| Personal Income and Outlays (PCE) | US | ★★★ |
| GDP, advance estimate | US | ★★★ |
| GDP, second estimate | US | ★★ |
| GDP, third estimate | US | ★★ |
| Retail Sales | US | ★★★ |
| Job Openings (JOLTS) | US | ★★ |
| Employment Cost Index (ECI) | US | ★★ |
| Weekly Jobless Claims | US | ★★ |
| Durable Goods Orders | US | ★★ |
| Trade Balance | US | ★ |
| Import and Export Prices | US | ★ |
| Housing Starts | US | ★ |
| New Home Sales | US | ★ |
| Fed interest rate decision (FOMC) | US | ★★★ |
| Fed rate decision and projections (FOMC) | US | ★★★ |
| Fed press conference | US | ★★ |
| FOMC minutes | US | ★★ |
| ECB interest rate decision | Euro area | ★★★ |
| ECB press conference | Euro area | ★★ |
Which chart to use it on
Any of them: the notch sits on the time axis and does not depend on the instrument or the timeframe. It helps most on intraday charts, where you can see which candle the figure came out in.
Adding it to the chart
In the chart bar, Indicators ▾ › More Indicators…. You’ll find it in the Other category. It is drawn on the time axis. How to add and adjust an indicator is in Indicators.
Settings
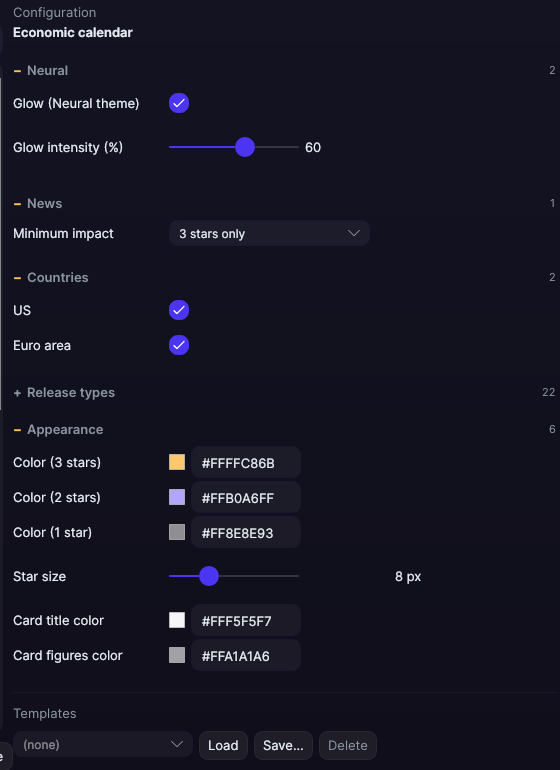
Open them with the ⚙ on its row in Indicators ▾.
| Setting | Default | Range |
|---|---|---|
| Neural | ||
| Glow (Neural theme) | Yes, when added | |
| Glow intensity (%) | 60% | 0 to 100 |
| News | ||
| Minimum impact | 3 stars only | 3 stars only · 2 and 3 stars · All |
| Countries | ||
| US | Yes | |
| Euro area | Yes | |
| Release types | ||
| One checkbox for each release in the table above (22) | Yes, all of them | |
| Appearance | ||
| Color (3 stars) | Amber | |
| Color (2 stars) | Violet | |
| Color (1 star) | Gray | |
| Star size | 8 px | 5 to 16 |
| Card title color | White | |
| Card figures color | Light gray | |