Footprint
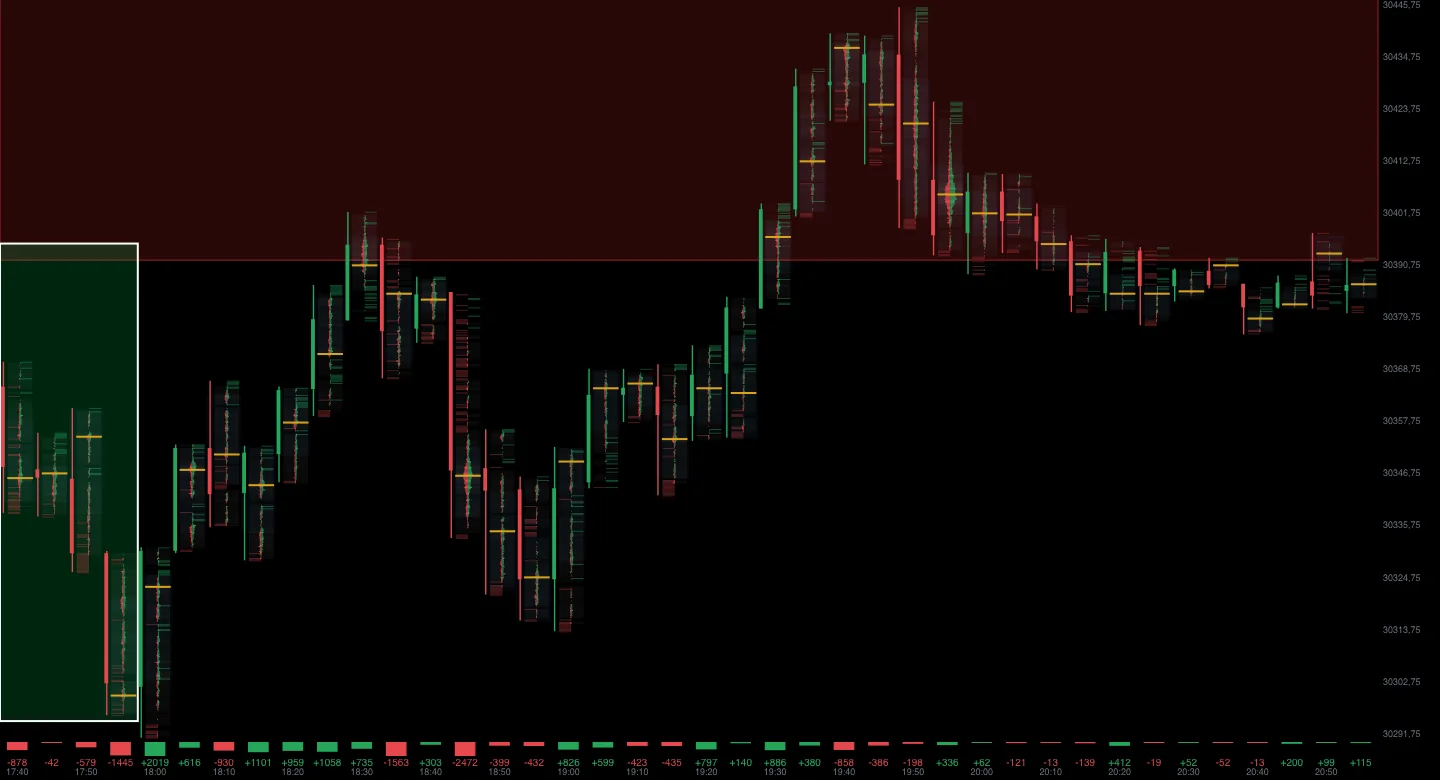
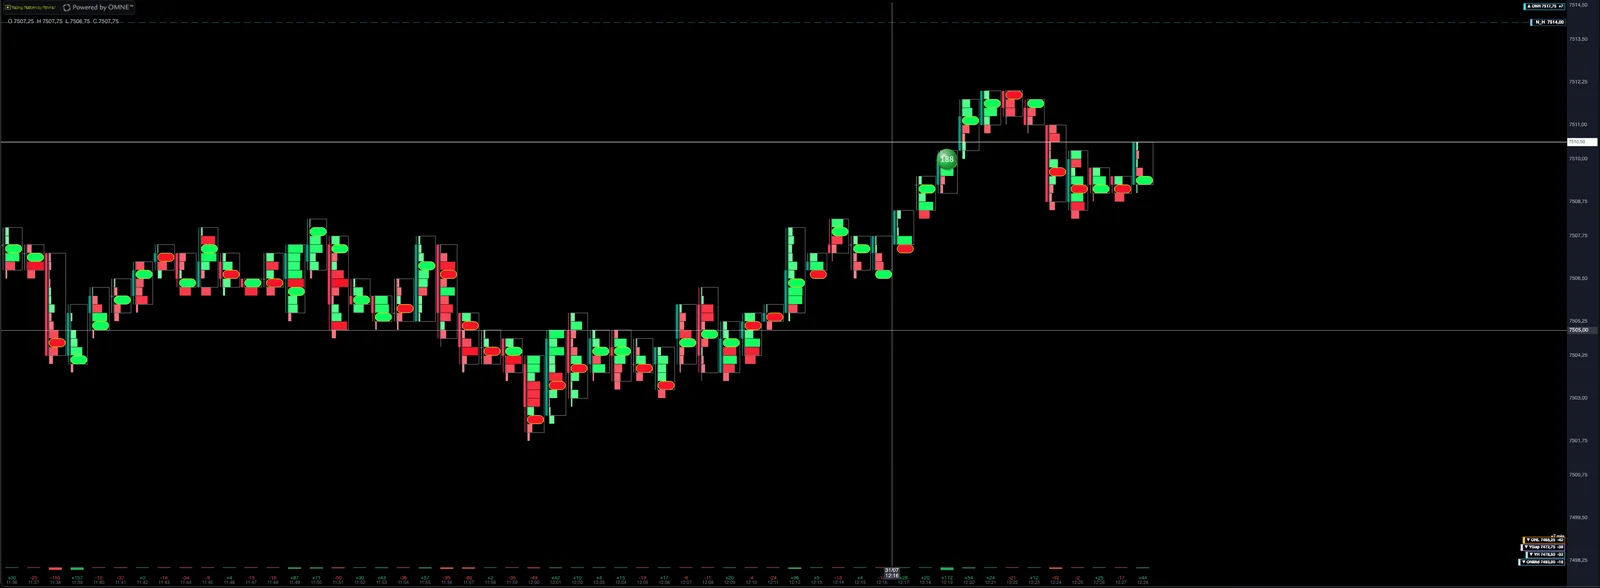
Bid×ask cells with readable numbers, diagonal imbalances, POC and value area. Stays legible even on a crowded chart.
Footprint, cluster zones, volume profile, VWAP, cumulative delta, big trades and session levels in one native platform. Live data and tick-by-tick replay. Free to start.
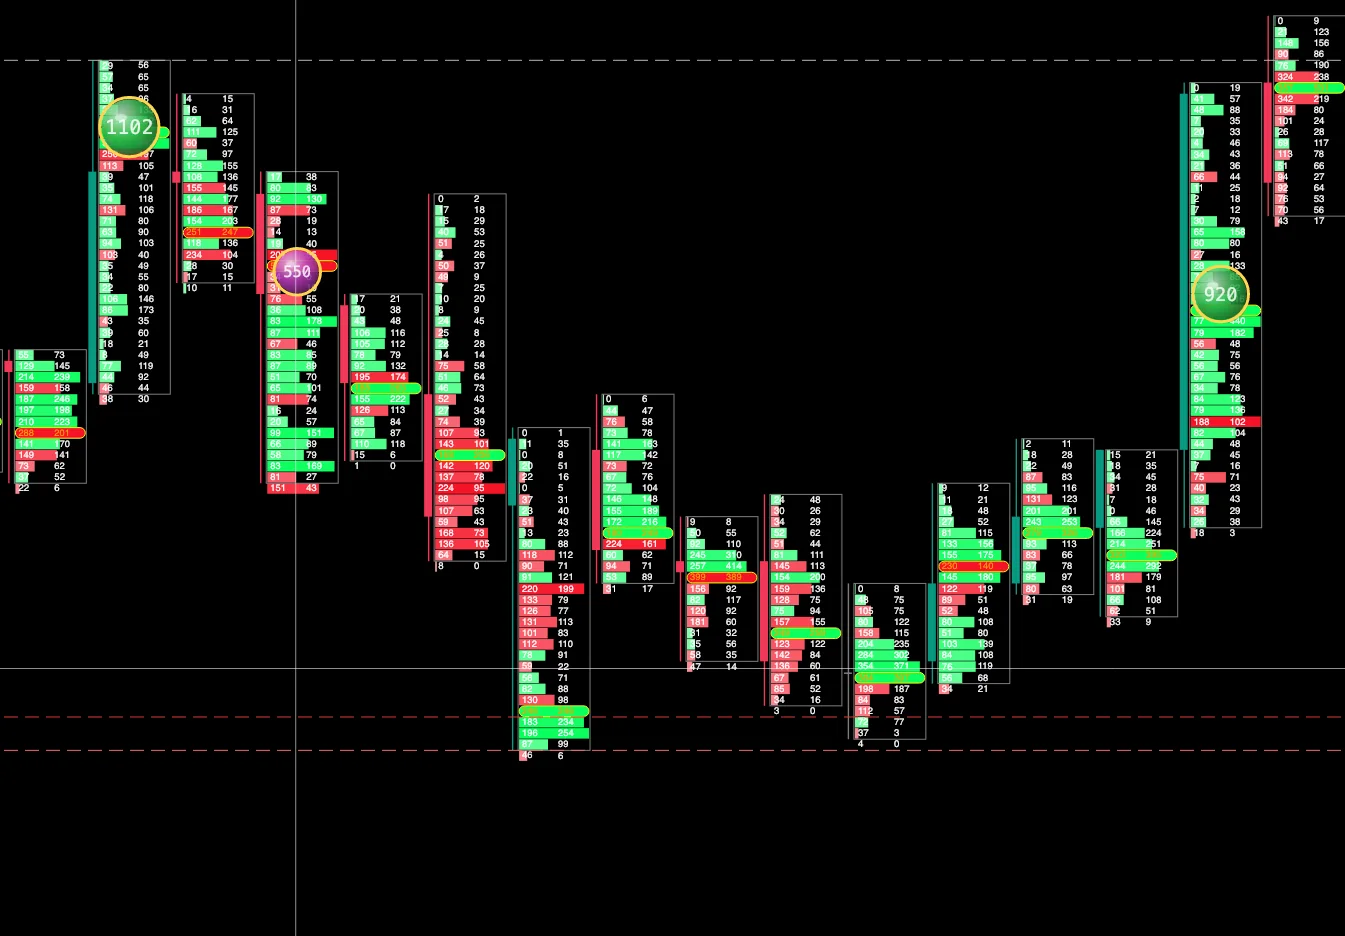 footprint · live
Our own GPU-accelerated chart engine. Every color, threshold and level is yours to adjust.
Bid×ask cells with readable numbers, diagonal imbalances, POC and value area. Stays legible even on a crowded chart.
Key candles and absorption zones that invalidate on touch. Reversals and continuations flagged live.
Volume profile of the visible range with 70% value area and POC, plus the session profile and yesterday's.
Session VWAP weighted by the real volume at each level, anchored to the open, with ±1σ / ±2σ bands.
Delta per candle and session cumulative delta in its own panel, colored by slope and auto-scaled.
Whales marked as bubbles on their candle, with an automatic percentile threshold or a fixed one of your choice.
Your key levels from the previous session — POC, VAH/VAL, naked and overnight — projected onto today and configurable in detail.
Rewind the market and watch every footprint form trade by trade, from 0.5× to 8×. For study and for recording.
Scroll and watch Forge stack each read on the same price.
Every candle split open: volume bought on the right, sold on the left. The POC in amber and the diagonal imbalances show you where price is fighting.
The engine flags key candles and draws the absorption zone. It stays until price touches it and invalidates it — reversal or continuation, in plain sight.
Session VWAP with its bands and cumulative delta in its own panel. You know whether real volume is driving the move or it's just noise.
POC, value area and naked/overnight levels from the previous session, projected onto today with labels pinned to the axis.
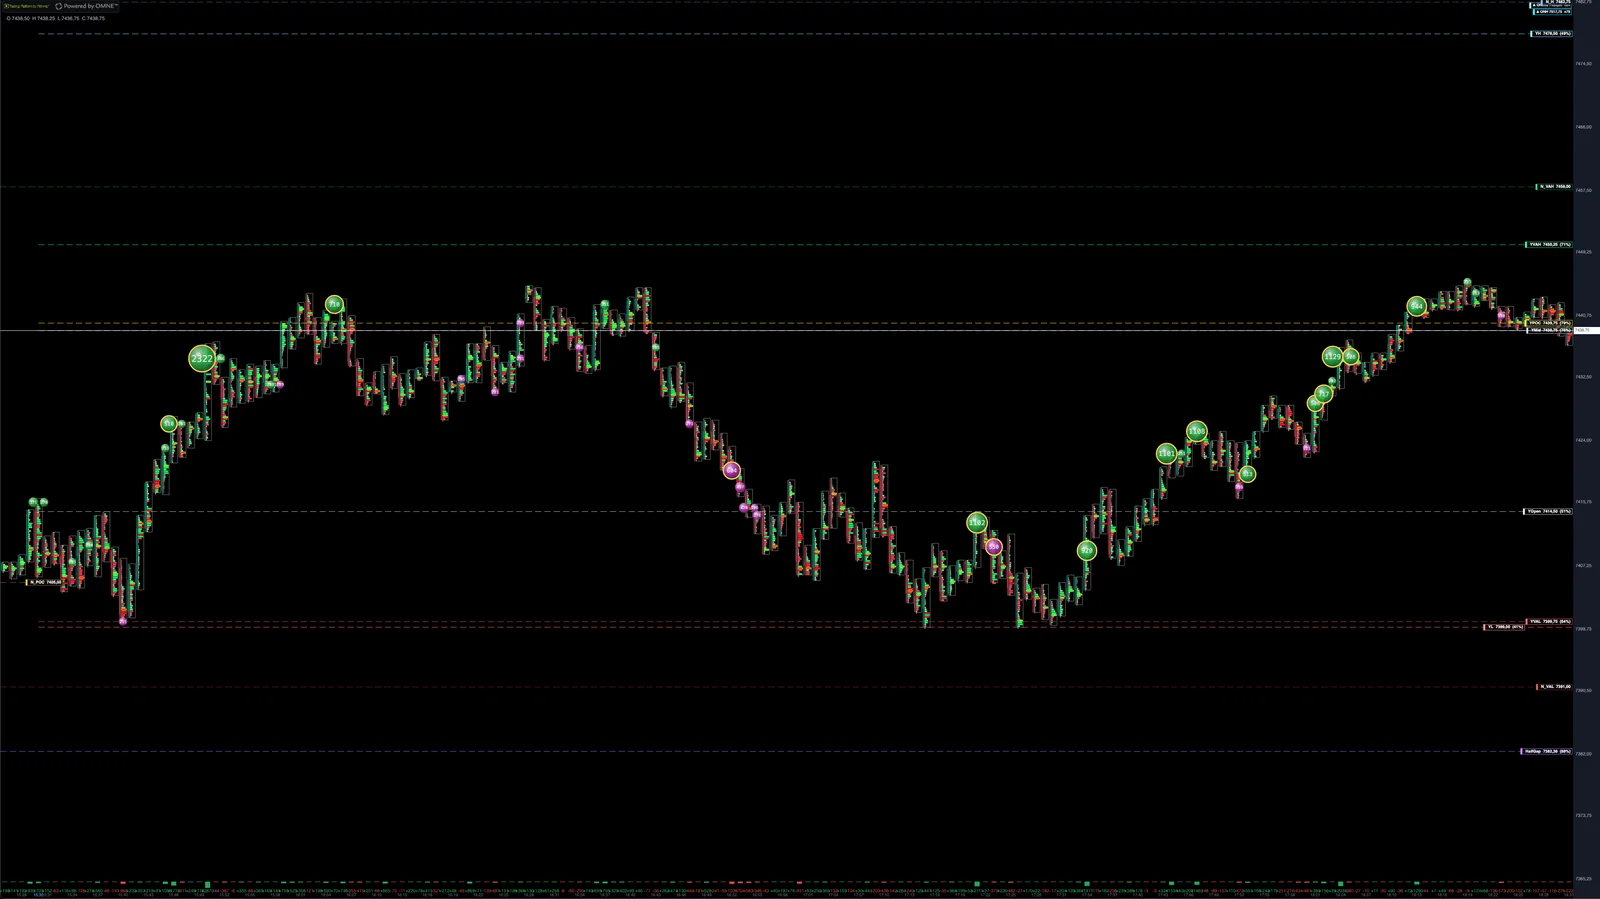
No mockups. Real data rendered by the engine.
Absorption zones, key candles and whales on a dense footprint. Each candle's delta at the bottom.
Replay any stretch, from 0.5× to 8×. To study the day or record a clip.
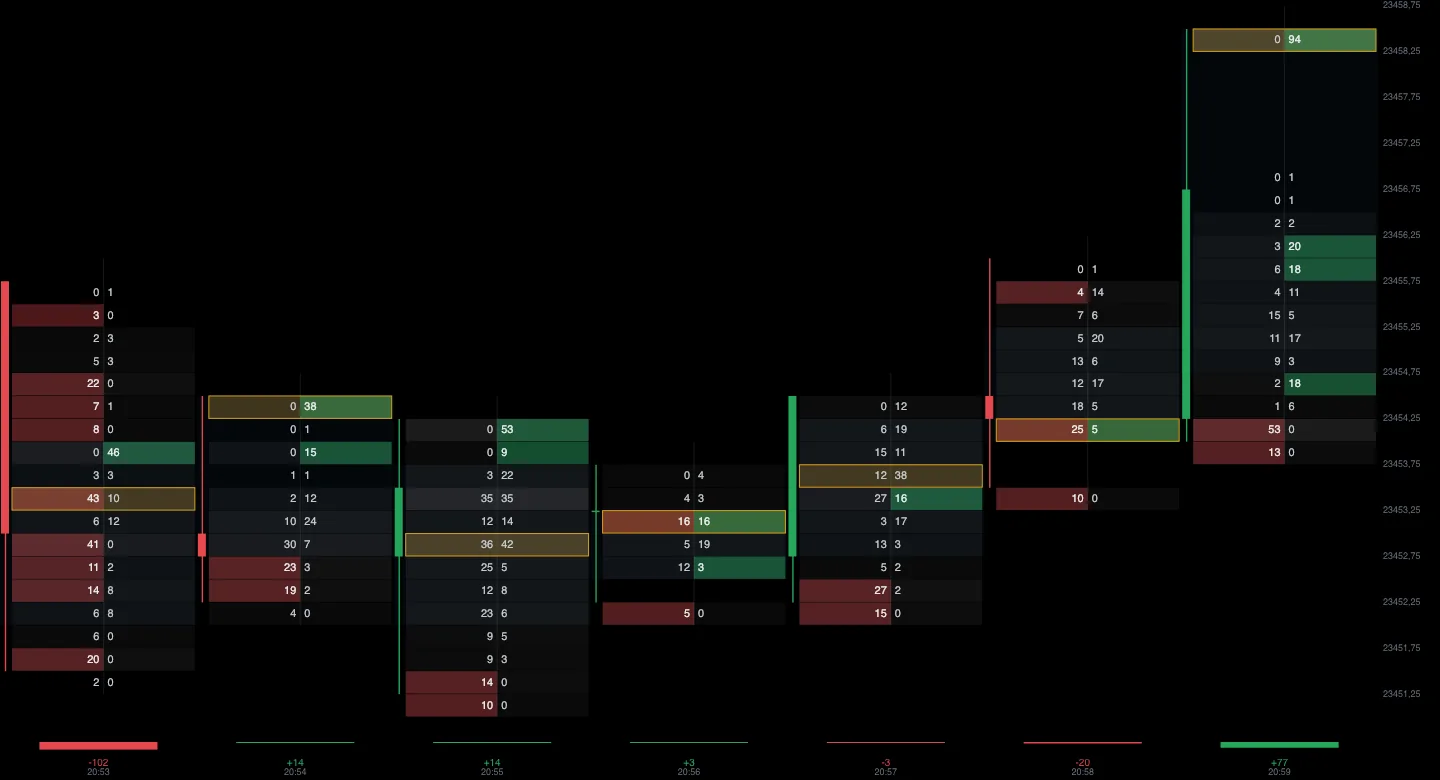
POC, value area and naked/overnight levels projected onto price, with labels pinned to the axis.
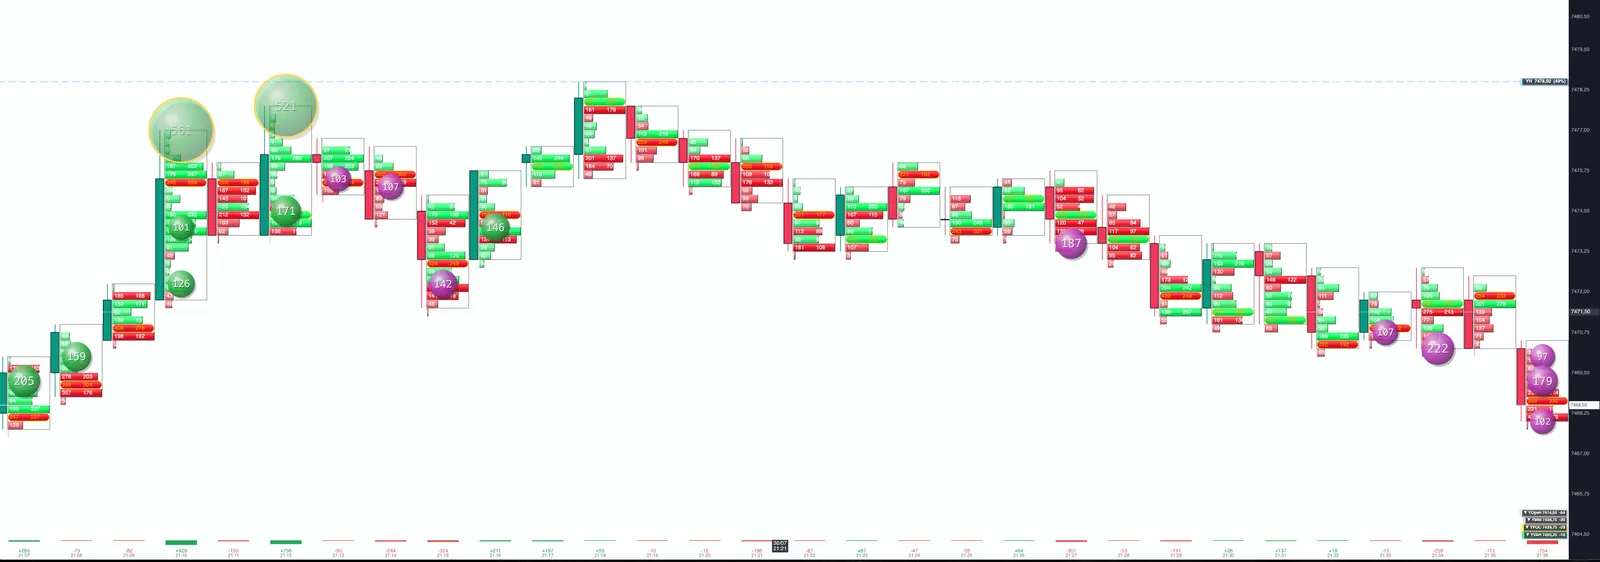
Color candles, whales and clusters, pick how big trades flash, and preview every change in a live window before applying it. Forge adapts to how you see.
Automatic record of every trade. Equity curve, heat calendar and each trade replayed on its candlestick chart.
Net P&L, win rate, profit factor, drawdown and streaks. The equity river shows each trade as an ember: green wins, red loses.
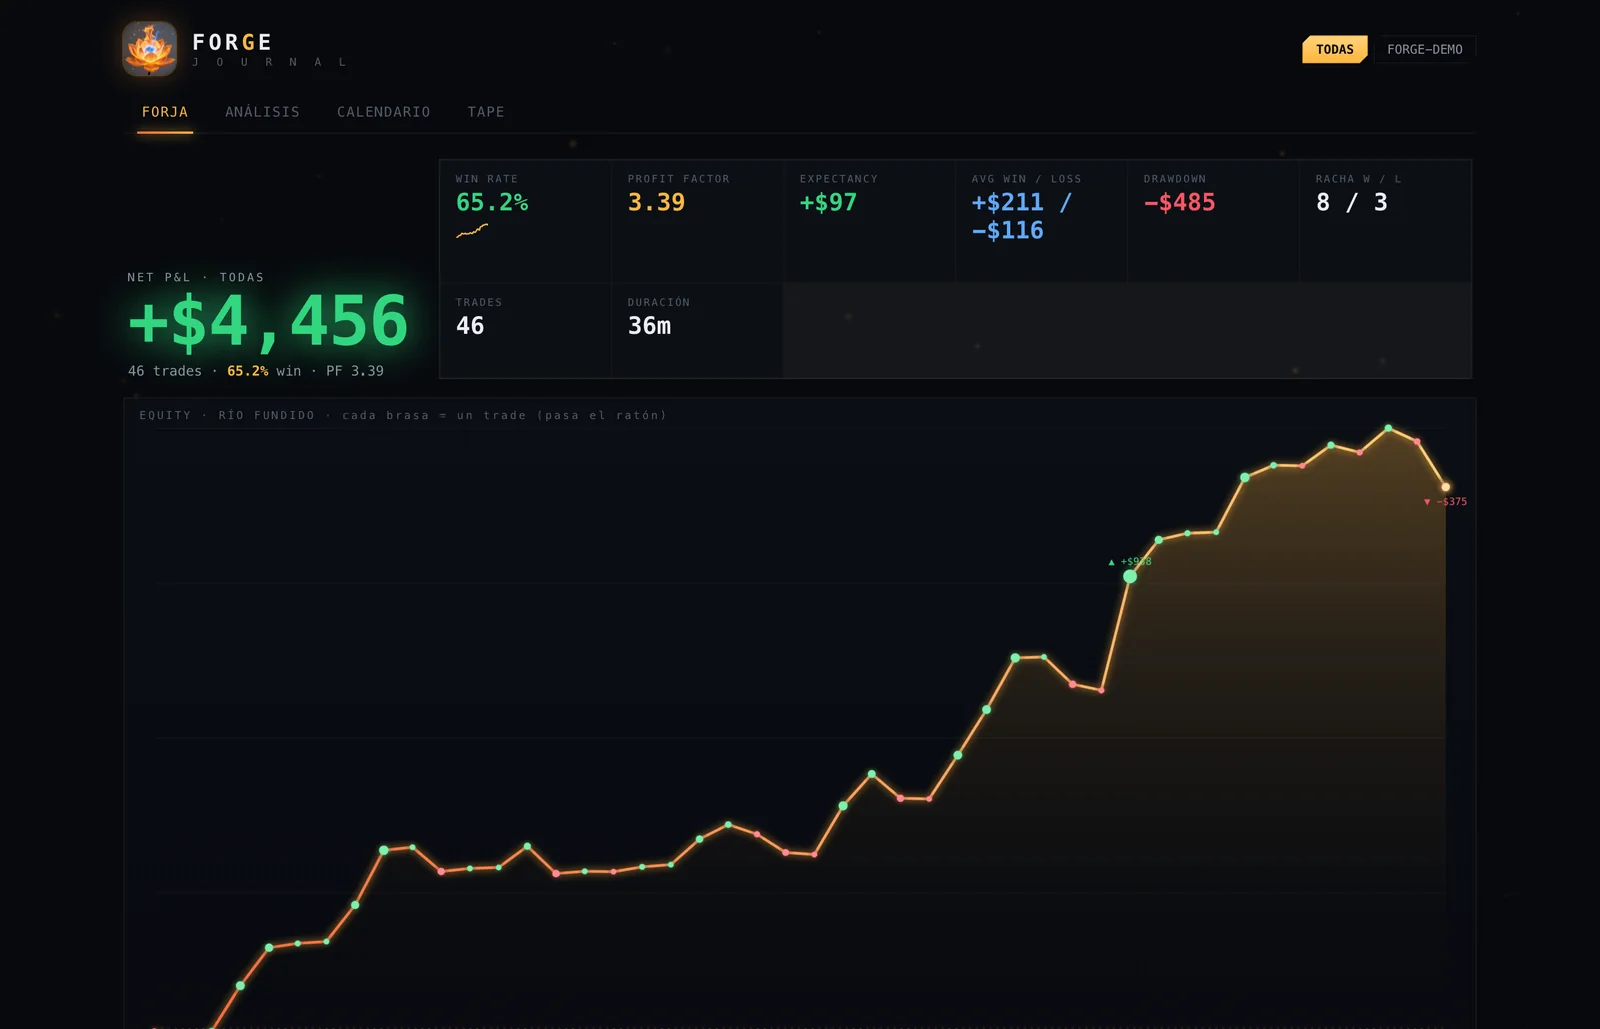
Open any day on the calendar and each trade is rebuilt with its candles, entry and exit marked. Review your trading in depth.
Every trade with its aggressor side: price, size and who swept the book. The footprint fills in by itself, in real time.
Switch between 1m, 5m, 15m or range whenever you want: Forge rebuilds the footprint from raw ticks instantly.
Footprint, big trades, volume profile, DOM, replay and multi-timeframe — the whole platform on your own connection. Just your email and a password: no card.